
RNP2 Boundary
Double-tapping any leg on the flight plan line will bring up the RNP2 boundary line to assist with the easy calculation of user LSALTs.
To dismiss the border, double-tap the route line once again.
LSALT calculation tool
Plus/Premium subscribers will also then have highlighted the height and position of the highest terrain and known obstacle within that boundary.
 LSALT calculator tool RNP2 boundary
 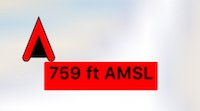 |
Highest Known Obstacle is shown with a red obstacle icon with elevation (feet AMSL) |
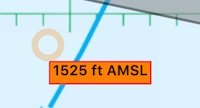 |
Highest terrain is circled in orange, with the corresponding elevation (feet AMSL) |
This user calculated LSALT is then easily selected and entered into the flight plan by tapping Accept. Ensure you have read and understood the disclaimer.
Tap the Setup button to reveal the other route calculation boundaries:

- RNP2 (5 nm either side of track)
- VFR (10 nm either side of track)
- RNP4 (15º splay to 8 nm with a 5 nm buffer)
- RNAV GNSS (15º splay to 7 nm with a 5 nm buffer)
- Non-GNSS RNAV (15º splay to 30 nm with a 5 nm buffer)
- Navaids/DR (varies depending on the strength of the navaid)
") LSALT calculator VFR (10nm)
LSALT calculator VFR (10nm) LSALT calculator Navaid/DR mode
User LSALTs are remembered
The selection you make will be stored and automatically entered in the flight plan table as a User LSALT. The same figure will then be used the next time you fly between those two waypoints.
Removing a User LSALT
Simply tap in the LSALT box in the plan and tap Enter. The default route or grid LSALT will be inserted automatically.
Direct-To LSALTs
If you calculate an LSALT on a Direct To leg, the figure is then viewable in the LSALT cell of the HUD.
Notes on terrain & obstacle elevation calculations
You can select between two different calculation modes: a worldwide digital terrain database (known as a Digital Elevation Model, or DEM), or a method that is equivalent to using the hypsometric tint from the map to determine heights. Plus/Premium users can select a preferred method by tapping Settings>User Settings and scrolling down to Advanced Settings at the bottom of the list.
For both methods, the result will always be at least as high as an LSALT based on a published spot height, and will typically be higher.
The Digital Elevation Model
This is a model containing ‘Level 0’ Digital Terrain Elevation Data (DTED) as described here. Level 0 data has a spatial resolution of 30 arc seconds in both Lat and Long between the equator and ±60 degrees of Latitude. AvPlan samples the DEM grid to find the highest point within or touching the LSALT boundary, adds the standard LSALT buffer of 1360’, then rounds this value up to the next nearest 100’.
Hypsometric Tints
AvPlan uses the DEM as above to find the highest elevation in the DEM model’s grid that is within or touches_the LSALT boundary. AvPlan then determines the top of the corresponding band in the Hypsometirc elevation scale, adds the standard 1360’ buffer and rounds up to the nearest 100’.
In some cases this method can be substantially more conservative than using the DEM alone, and may not be the most appropriate choice.
Obstacle Heights
AvPlan uses a published obstacle database that contains approximately four times as many obstacle references as are marked on Australian charts. The obstacle that is determined to have the greatest elevation within the LSALT boundary may or may not therefore correspond to a charted object, but will always be the highest known obstacle.
Need more help with this?
Help Centre (Tap and hold to open the Link)